See what is happening across every asset.
I build a working management and control system:
for every asset you see the results, commitments, deviations and what needs your decision.
Over 20 years in financial management.
Clarity begins before the dashboard.
When reports give different numbers, I first check the data and the accounting rules. A clear dashboard is built on that foundation.

-
Dashboard
Indicators, deadlines, deviations: what the owner sees.
-
Consolidation across assets
Each asset reports in its own format; the overall picture is pieced together by hand before each meeting.
I bring all assets into one model and one picture.
-
Accounting setup
The deviation is visible, but no one can explain the cause.
I set the rules, owners and cadence so that plan and actual are always compared the same way.
-
Classification
Figures for the same thing differ from one report to another.
I introduce common line items, reference lists and cost allocation rules.
-
Source data
Data sits in contracts, exports and other people’s files; no one has checked that it is complete.
I check where the data comes from, whether it is complete and who is responsible for it.
How the control system is built.
I define the owner’s task, check the accounting, set up the system and agree how it will be used.
-
01
Owner’s task
We find out which assets you manage, what decisions you make and what picture you want to see. We look at how your accounting works today.
ResultAgreed scope of the report.
-
02
Accounting diagnostics
I check data sources, rules and how the data is prepared: who, when and in what order. If accounting is reliable, I build the report on top of it; if there are gaps, I define what to change.
ResultWritten findings: a list of gaps and actions.
-
03
System setup
I set up management accounting and create a dashboard for the agreed tasks.
ResultA working control tool.*
-
04
Handover and updates
I explain how to work with the report, agree on responsible people and the update schedule. Further support by arrangement.
ResultRegular reporting.
When things go well, you understand the reasons for success.
When there are problems, you see the causes and your options.
* The interactive report is delivered as an HTML file and opens in a browser on your computer. No data leaves it for the internet.
I work with real data only after a confidentiality agreement.
Business
See how a management dashboard works.
Open an example and choose a project, period or business line. Watch how the figures change and where deviations appear. Demo data.
-
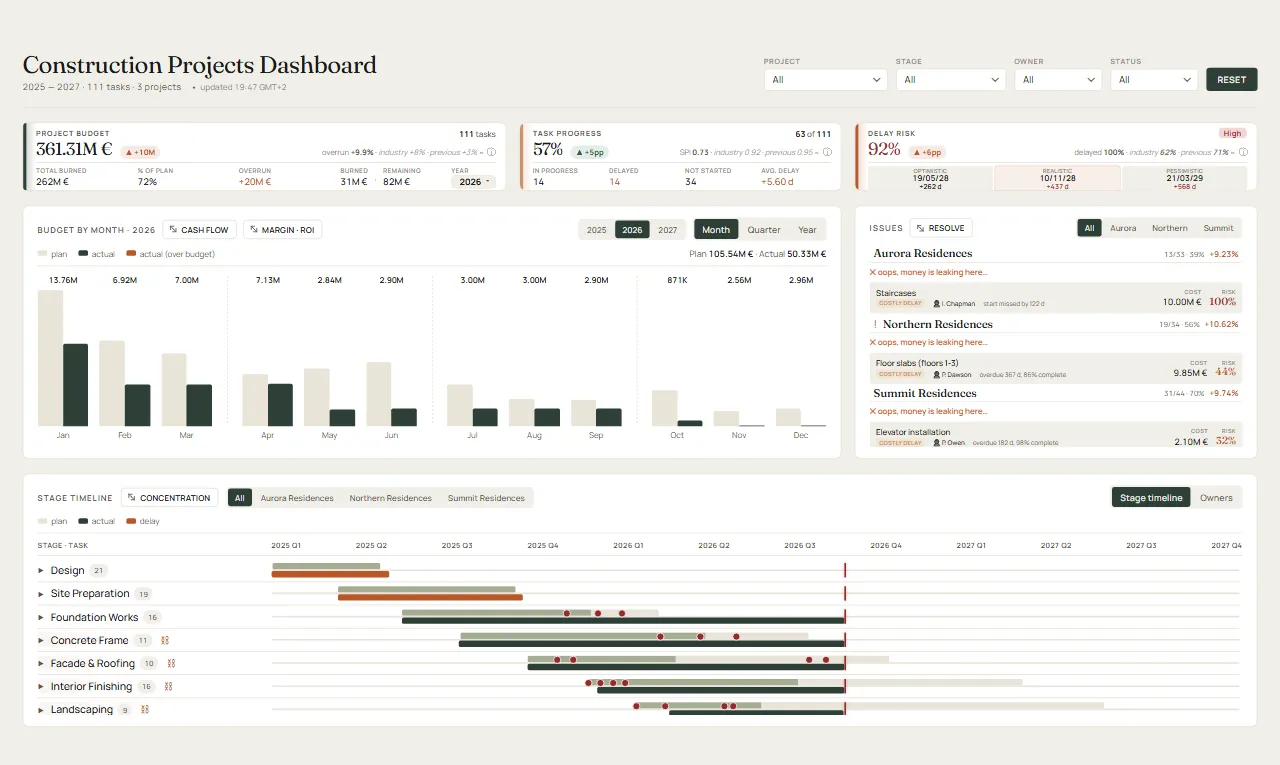
Construction
Interactive
Budget, payments and timelines for each project. Overrun and delay checks.
-
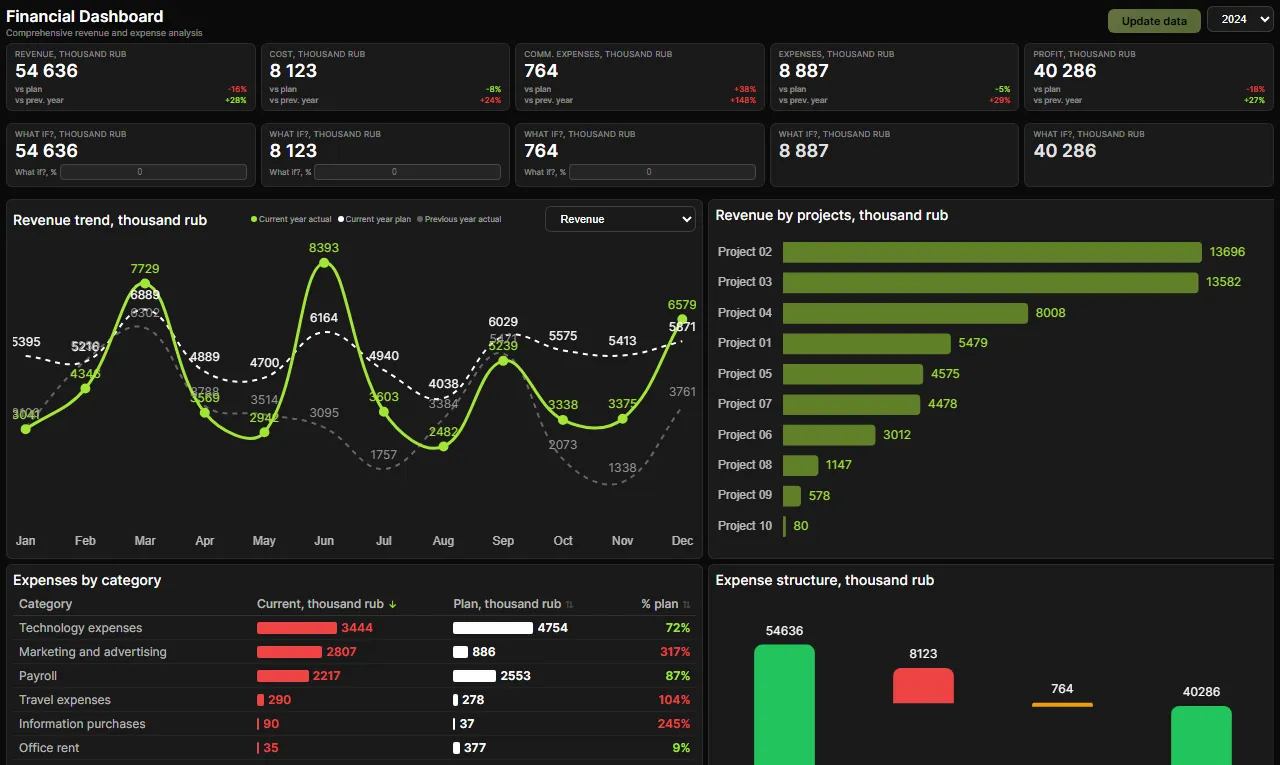
Financial control
Interactive
Income, expenses and results by business line. Plan vs actual.
-
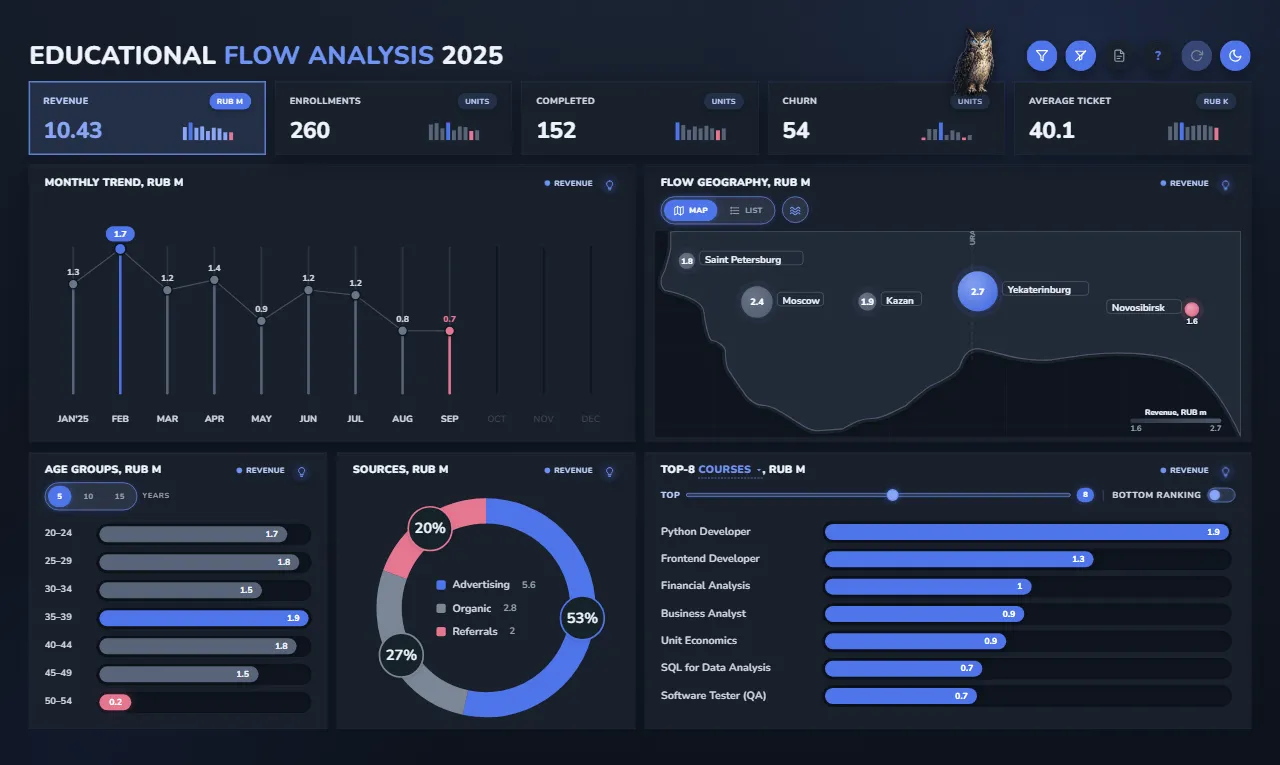
Education
Interactive
Enrolment trends, capacity and how students are spread across programmes.
-
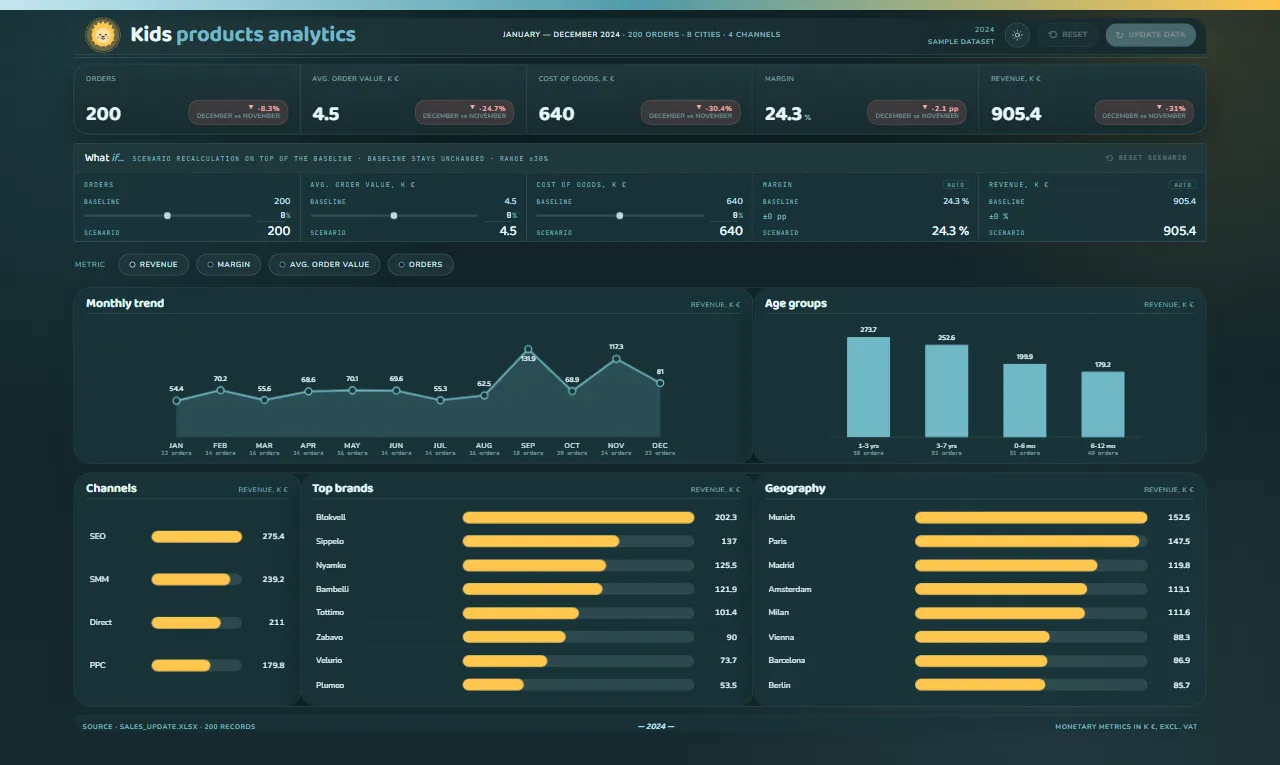
Retail
Interactive
Revenue and margin by brand, sales channel and city.
From a company budget to an international fund’s portfolio.
For more than 20 years I led financial and economic planning, budgeting and methodology in companies across different industries. I implemented management accounting and consolidated reporting, and took part in audits and in selecting companies for investment. I show not only the result but also the reasons for deviations. I build accounting and dashboards around your business, not a ready-made template.
The most complex assignment
All of the fund’s assets —
in one system
For an international private fund, I designed and implemented unified management accounting across different asset classes. Since then, the owners have seen the overall picture and each asset separately, without delay — and it is immediately clear where their decision is needed.
- Real estate houses, villas, apartments, land4 countries
- Yachts 3 vessels of different classes
- Business aviation business jet
- Vehicle fleet
- Investment projects construction, media, hotels
- Securities
Banks in 7 jurisdictions · Currencies: EUR, USD, GBP, CHF
Anonymised case
Working tools: Excel · 1C · Power BI · AI tools. I choose the tools to fit the task and your existing accounting.
Let’s discuss your task.
Tell me which assets you manage and which figures are hard to keep under control right now. In our first conversation we will work out what is unclear in your numbers and where to start.